Analysing Covid19 India data
Update on Sept 14, 2020
An analysis of the Covid-19 fatalities Tamil Nadu (May 5 – September 5, 2020)
Update on May 25, 2020
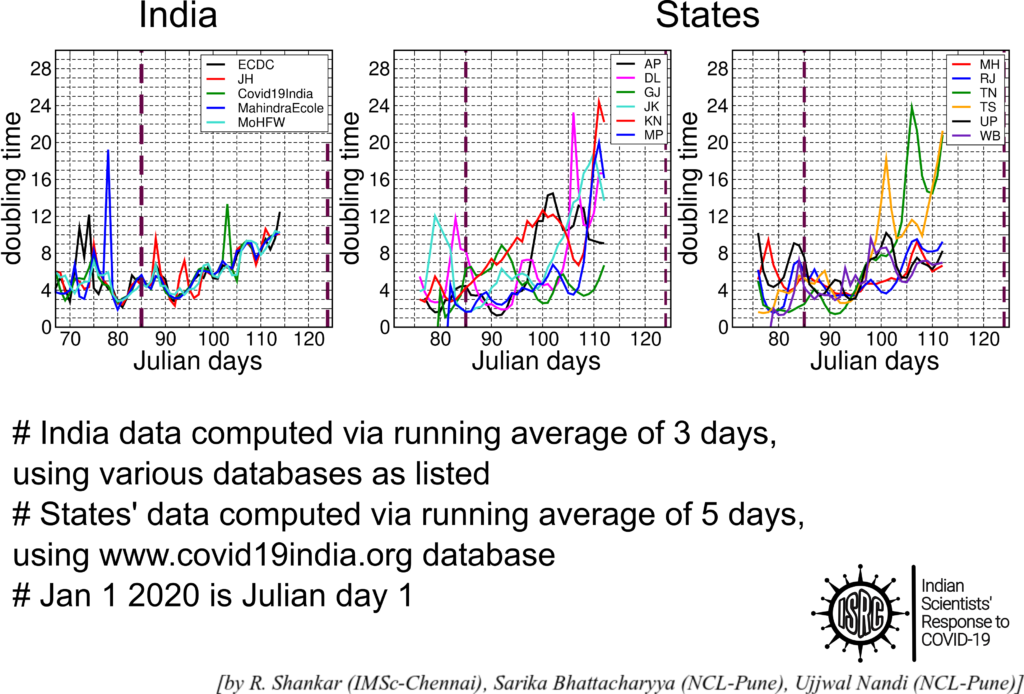
A daily dashboard presenting the time-series of some quantitative measures which track the spread of the epidemic in the country, using publicly available data, has been built. Note that the detected number of cases and thereby all these measures are affected by testing strategies that induce bias in the sampling. They are also affected by errors in the data due to mis-reporting of fatalities and recovered and randomness in the time lags in reporting them. Nevertheless, we feel that they provide a broad overview of the pan-India situation, with focus on some of the most affected states, capturing the main message that there is a lot of heterogeneity in how the epidemic is spreading in the country.
Update on April 25, 2020

Report dated April 17, 2020
Main results
National level analysis
- A comparison of different data sets in section 2.2 of the report shows systematic inconsistencies between the MoHFW data and the rest.
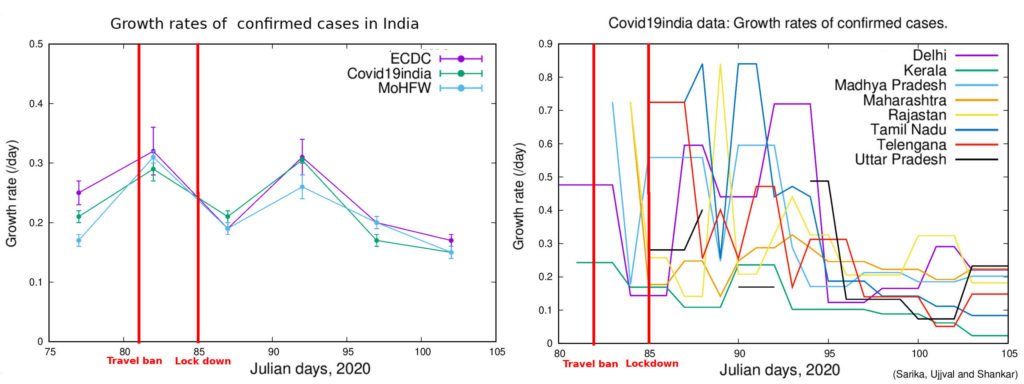
- An analysis of the time evolution of the growth rates of the total number of confirmed cases in India in section 2.3 of the report shows effects of the travel ban and the lockdown.
- The growth rate of confirmed cases has been decreasing from around the begining of April.
State level analysis
- The growth rates of the confirmed cases in the five states analysed in section 3.1 of the report show significant variation. Currently, the doubling time varies from 4.5 days in Maharashtra to 11.3 days in Kerala.
- The growth rates of all these five states are generally decreasing after around April 2.
- An analysis of the ratio of the number of confirmed cases where contact tracing was not possible to those where it was possible (done in section 3.2 of the report) shows that, on April 9, 8, eight of the seventeen states that have reported cases, have this ratio greater than 10. This indicates that community transmission had set in strongly in about half the states that have confirmed cases about a week ago.
- In Maharashtra, the above ratio was about 125 on April 9, the highest among all states. This may be the primary reason that it also has the highest growth rate of confirmed cases.
Impact of travel ban and Lock down
The overall impact of the travel ban and lock down can be gauged from the figure shown above.
There is an initial dip in the national data and that of several states just after the travel ban was imposed. After that, till the begining of April, the growth rates of the individual states fluctuate and the national growth rate increases. After the beginning of April, the national growth rate and the overall trend of the state growth rates have been decreasing. However, only Kerala and Tamil Nadu show a consistent decrease after April 5 (Julian day 96). It seems natural to conclude that the decrease of growth rates in April is a consequence of the lock down, it seems to have taken about a week to have a significant effect. Of the states analysed only Kerala and Tamil Nadu seem to been able to use the first phase of the lock down to steadily bring down their growth rates. The other six seem to be still struggling.
We repeat the caveat that all the above statements are based on the growth rates of the confirmed cases which may or may not reflect the trends of the actual number of cases.