Modelling Resources
In view of the current Covid 19 epidemic, mathematical modelling is being used to predict the spread and impact of the disease under various conditions in different communities. The goal is to use such predictions by policy makers to optimally fight the disease and make well-informed strategic decisions. Below are summaries and links to some of these studies which are receiving critical attention.
#1 Estimating the number of infections and the impact of non- pharmaceutical interventions on COVID-19 in 11 European countries
Authors: Seth Flaxman et al (Imperial College COVID-19 Response Team)
Type: Report
Click here for Summary
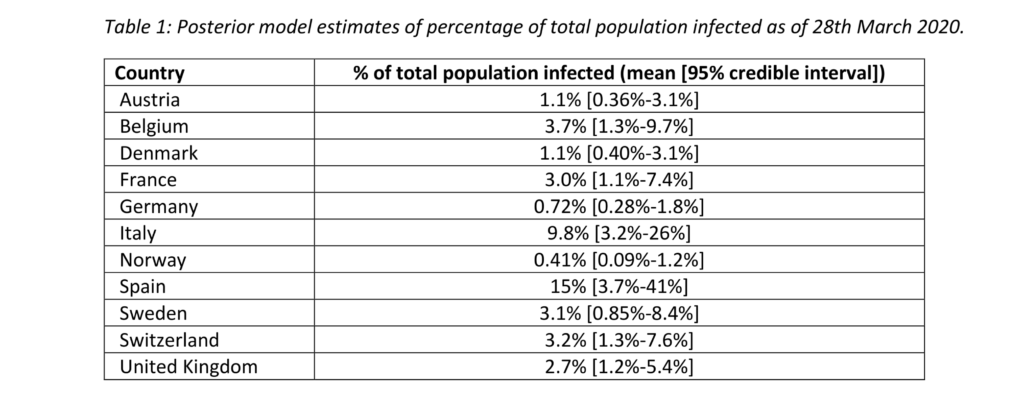
In this report, dated March 30, the authors study how non-pharmaceutical interventions in the form of social distancing, border closures, school closures, isolation of symptomatic individuals and their contacts, and large-scale lockdowns of populations, affect the spread of the epidemic. This is done by utilising daily real-time death data for 11 European countries as documented by European Centre of Disease Control, and using a new Bayesian model for the infection cycle to fit this data, and thereby infer a posteriori the upper and lower bounds of the total populations infected and importantly the reproduction number over time (average number of infections, at time t, per infected case). For all 11 countries, the model estimates that the detected number of infections are orders of magnitude fewer than what is detected by testing, with an initial reproduction number of around 3.87 prior to any non-pharmaceutical intervention. Finally, they estimate that such interventions systematically decrease the reproduction number to as low as 0.98 (e.g. for Norway), which can have dramatic influence on decreasing the number of fatalities, e.g. in Italy, 38000 deaths are estimated to be averted due to the interventions. Thus, these estimates demonstrate how significant the interventions are in having some control over the evolution of the epidemic and thereby prevent a catastrophic health crisis.
#2 Predicted Infections and Hospitalizations in India
Authors: Eili Klein, Gary Lin, Emily Schueller, Geetanjali Kapoor, Ramanan Laxminarayan
Type: Report

Click here for Summary
This study forecasts the timeline of covid19 outbreak in India and makes policy recommendations to overcome the epidemic. The details of the underlying model is scant [1]. It seems to be a combination of the agent based simulation of Indian population and a compartmental model for disease transmission for a time window upto July. It considers the age and gender demography of India . However, the values for the key parameters for disease transmission model are taken from China and Italy. The authors consider three scenarios of risk – high, medium and low and make separate predictions for each case for the whole of India and for each state. The main result is the prediction of a huge number of infections (asymptotic + hospitalized + symptomatic). The number of hospitalized cases alone is predicted to be in the range 1-2.5 million for different scenarios. The peak of the epidemic is forecasted to occur somewhen between April and June.
Ref: [1] Health and economic benefits of public financing of epilepsy treatment in India: An agent-based simulation model, Itamar Megiddo, Abigail Colson, Dan Chisholm, Tarun Dua, Arindam Nandi, and Ramanan Laxminarayan, Epilepsia, 57(3):464–474, (2016)https://doi.org/10.1111/epi.13294
#3 Age-structured impact of social distancing on the COVID-19 epidemic in India
Authors: R. Singh and R. Adhikari
Type: Preprint
Click here for Summary
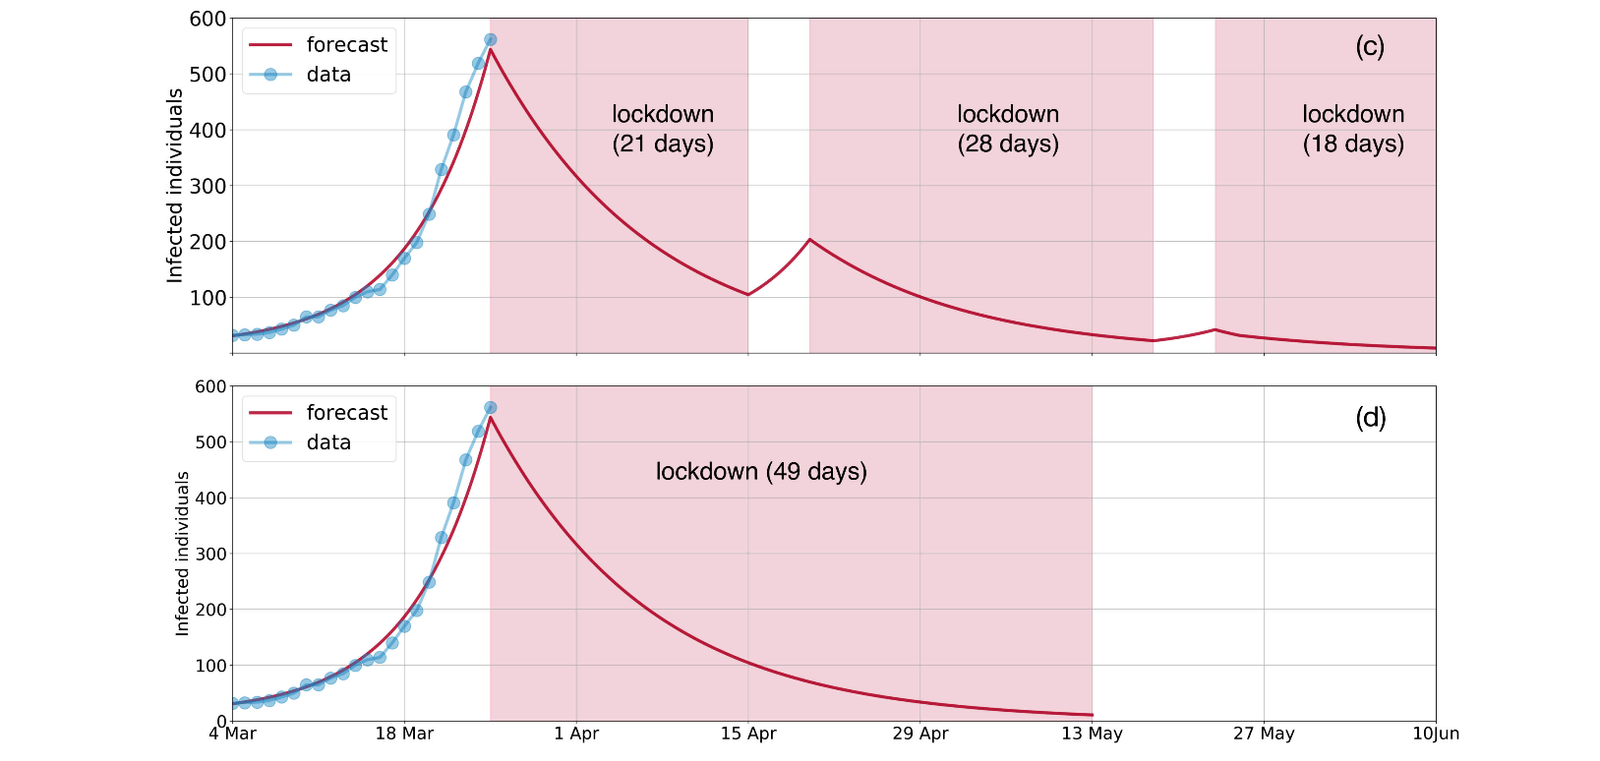
The rate of spreading of the COVID-19 epidemic in a population depends on the social interactions present in the community. The mortality rate of the disease, on the other hand, is related to the age structure of the population. Here the authors incorporate information about both of the above into a modified SIR model of epidemic spreading and apply it to the Indian population. Each compartment of the SIR model is further categorized into 16 age brackets and the social contact network is divided into home, office, school and others. The effect of enforced social distancing on the epidemic spread is estimated via modification of the time-dependent social contact network. Though the model allows for asymptomatic carriers, due to uncertainty in these numbers, the authors present results for the case of no asymptomatic carriers. Even in this best-case scenario, the authors claim show that a 21 day lockdown is insufficient to bring down the number of infections below an arbitrary threshold of 10 individuals. They assume that contact tracing and quarantine will be effective only below this threshold. If all the social contacts are reactivated after the lockdown, the epidemic will again grow. Thus, a longer lockdown period, or a series of lockdowns with recovery time is recommended.
#4 Early Transmission Dynamics in Wuhan, China, of Novel Coronavirus–Infected Pneumonia
Authors: Qun Li et al.
Type: Published (The New England Journal of Medicine)
Click here for Summary
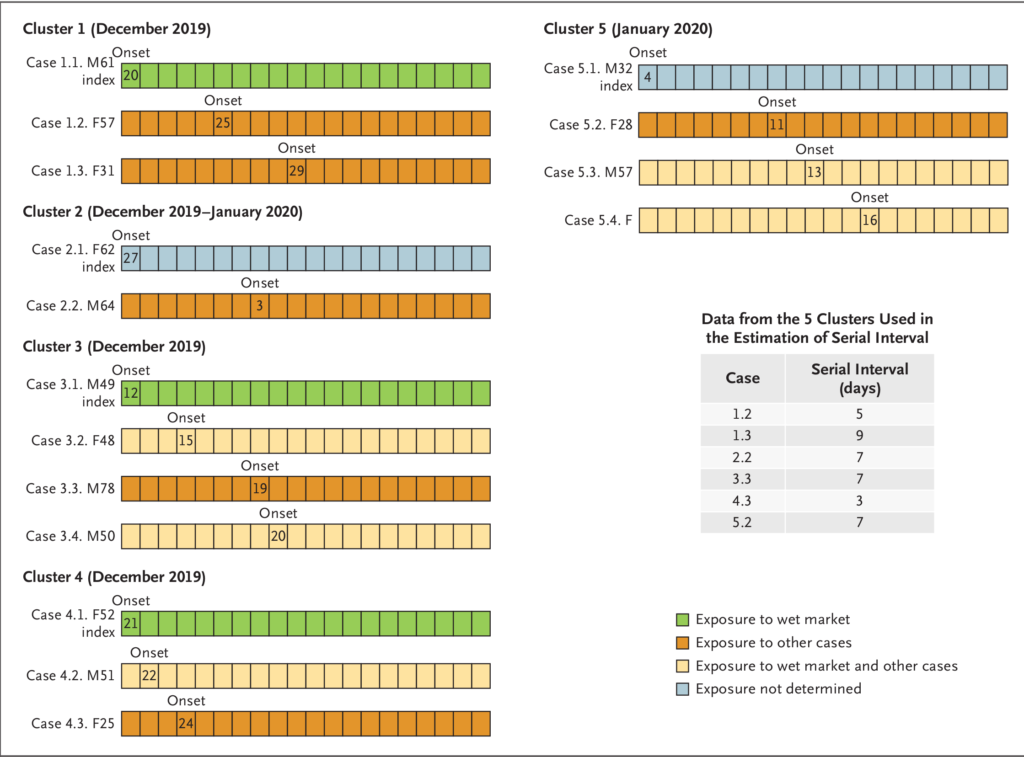
Aim of the study was to determine the epidemiologic characteristics of Novel Coronavirus (2019-nCoV)–Infected Pneumonia. Data were collected for the first 425 laboratory confirmed cases reported until 22 Jan in Wuhan, onto standardized forms through interviews of infected persons, relatives and health care workers etc. Authors report that initial patients were identified by local hospitals using a surveillance mechanism for “pneumonia of unknown etiology” that was established in the wake of the 2003 SARS outbreak. Demographic characteristics of the patients are summarized in Table 1. The median age of these patients was 59 years (range 15 to 89 years) and 56% were male. The mean incubation period, defined as the time delay from infection to illness onset, was 5.2 days (95% confidence interval [CI], 4.1 to 7.0), with the 95th percentile of the distribution at 12.5 days. The serial interval, defined as the delay between illness onset dates in successive cases in chains of transmission, had a mean ±SD of 7.5±3.4 days (95% CI, 5.3 to 19). This estimate is based on information on 5 clusters of cases, as shown in Figure 3. The epidemic doubling time was 7.4 days (95% CI, 4.2 to 14). The basic reproduction number, defined as the expected number of additional cases that one case will generate over the course of its infectious period in an otherwise uninfected population, R0 was 2.2 (95% CI, 1.4 to 3.9). For comparison, R0 was 3 for SARS. These are the first estimates for the epidemiological characteristics for Covid19 and need to be compared with that from other countries.
#5 Early dynamics of transmission and control of COVID-19: a mathematical modelling study
Authors: Adam J Kucharski, Timothy W Russell, Charlie Diamond, Yang Liu, John Edmunds, Sebastian Funk, Rosalind M Eggo, on behalf of the Centre for Mathematical Modelling of Infectious Diseases COVID-19 working group, London School of Hygiene & Tropical Medicine London, UK
Type: Published paper
Click here for Summary
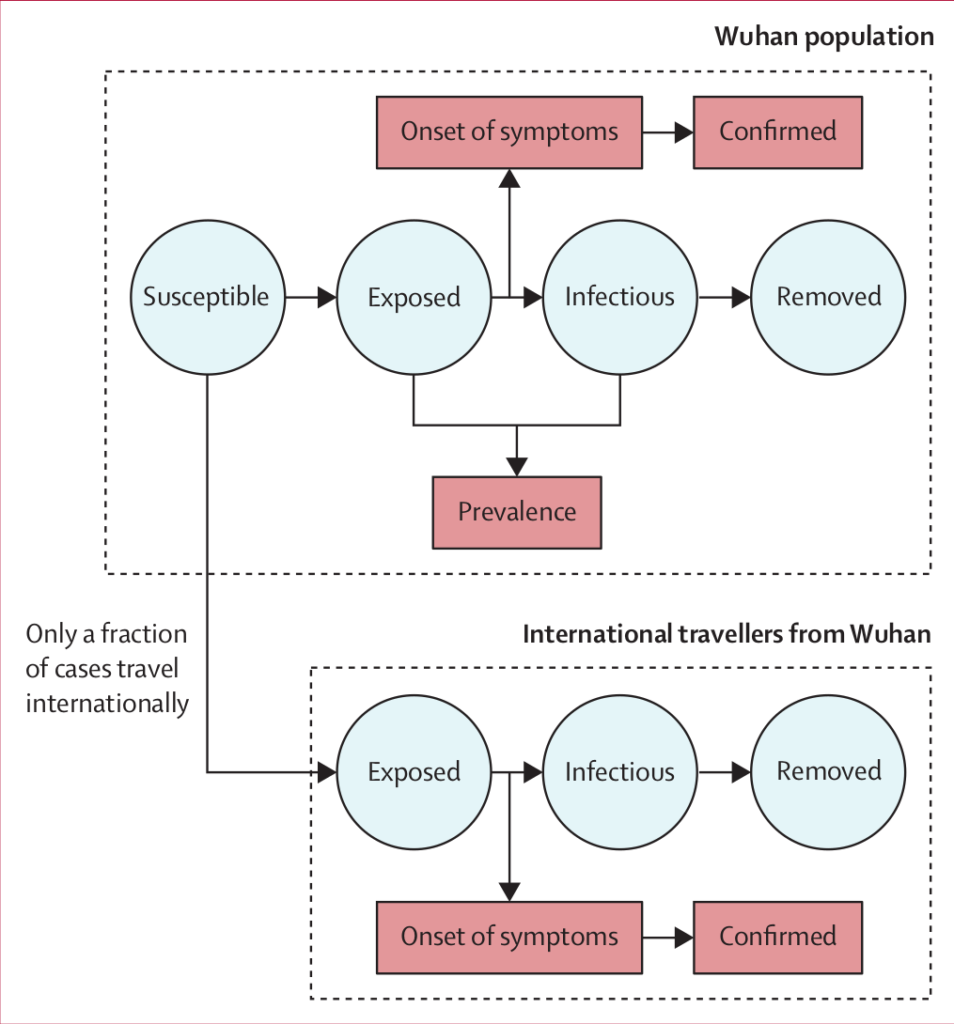
This paper studies the transmission of covid19 in the early days of the pandemic from early December upto Feb 11, 2020. The authors focus on the outbreak in Wuhan, China, and how the disease is transmitted to top 20 highly connected other countries by international travel. The outbreak among the population of Wuhan and the international travellers outgoing from Wuhan is described by an extended version of stochastic, SEIR compartmental model (see appendix) .The model explicitly considers asymptomatic population, an incubation period, and the uncertainty in various available data by introducing randomness in the parameters. However, the authors do not consider age and gender structure of the population. Possible transmission timelines of outbreak were simulated by a sequential monte carlo method. The model parameters are determined by fit to four data sets about the daily number of cases in Wuhan and in China, and the data on international outgoing (infected) passengers. The predictions from modelling were compared against new confirmed cases and daily number of new exported cases. One key conclusion from the study is that the time dependent daily reproduction number $R_t$ decreased after the lock down imposed on 23 January 2020, although started to rise again after one week into lockdown. The second key conclusion is the analysis of the probability of large outbreak from a given number of seed infected individual suggest multiple introductions required for the outbreak. This is an important issue because it quantitatively indicates the importance of rapid identification and isolation of infected persons any other control measures to reduce the chance of transmission.
#6 A critique of the Covid-19 analysis for India
Authors: Singh and Adhikar
Type: Published Paper
Click here for Summary
Singh and Adhikari present results of an analysis of a mathematicalmodel of epidemiology based on which they argue that a 49 day lockdown is required in India forcontaining the pandemic in India. We assert that as a model study with the stated assumptions, the analysis presented in the paper is perfectly valid, however, any serious comparison with real data and attempts at prediction from the model are highly problematic. The main point of the present paper is to convincingly establish this assertion while providing a warning that the results and analysis of such mathematical models should not be taken at face value and need to be used with great caution by policy makers.
#7 Prudent public health intervention strategies to control the coronavirus disease 2019 transmission in India: A mathematical model-based approach
Authors: Sandip Mandal, Tarun Bhatnagar, Nimalan Arinaminpathy, Anup Agarwal, Amartya Chowdhury, Manoj Murhekar, Raman R. Gangakhedkar & Swarup Sarkar
Type: Published (in Indian Journal of Medical Research)
Click here for Summary
Summary: During the early stages of the COVID-19 epidemic in India, one major concern was related to passengers arriving from infected countries. One important question was to whether thermal screening of incoming passengers at airports will lead to significant delay in the onset of community transmission in India. Once community transmission sets in, the effects of quarantine of symptomatic individuals on mitigation of the epidemic is necessary to be quantified. Using a suitable SEIR model for epidemic spread along with a stochastic model for entry and community transmission within 4 major cities, the authors addressed the above questions. The authors found that, in addition to symptomatic passengers, about 90% of the asymptomatic passengers would need to be screened in order to delay the onset of community transmission (1000 infected people nationwide) by 20 days, thus it was suggested that mitigation strategies were important. Quarantine of symptomatic cases within 2 days causes a 90% reduction in infections over a longer duration of 400 days. This work was carried out in early March and the authors did not consider more stringent mitigation measures such as physical distancing or lockdown.
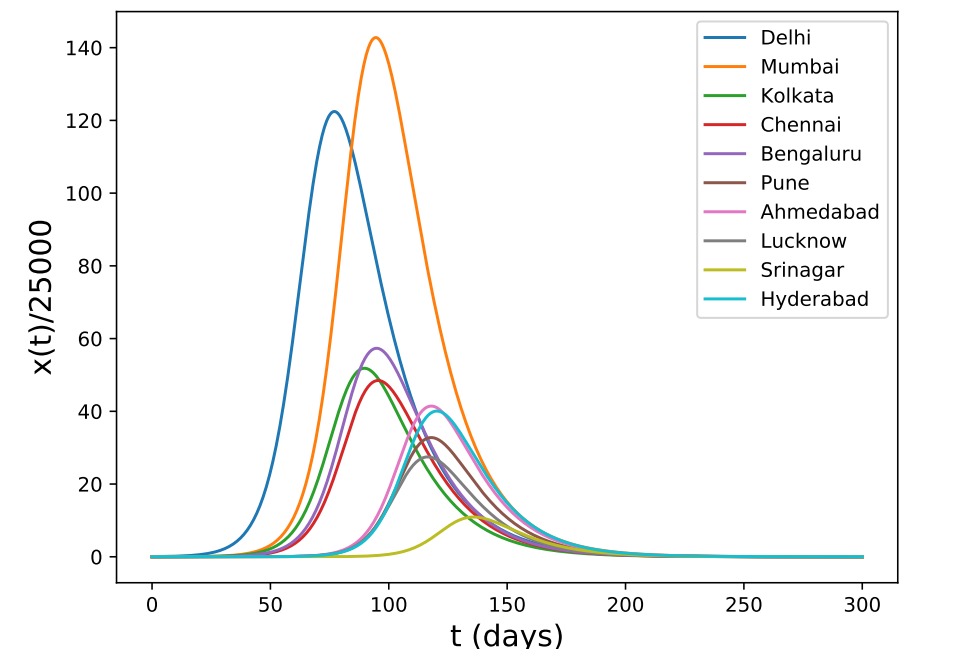
#8 Multi-city modeling of epidemics using spatial networks: Application to 2019-nCov (COVID-19) coronavirus in India
Authors: Bhalchandra S Pujari, Snehal M Shekatkar
Type: Preprint
Click here for Summary
The paper presents a computational meta-population model to estimate the spreading of Covid19 in India via railway and aviation networks. The basic epidemiological model is an SIR model, and this is used to model a particular city. The authors construct an adjacency matrix A_{ij} using aviation and railways data (69 aviation and 320 railway links) linking more than 300 Indian cities. The weights of the matrix are constructed under the assumption that the total population of a city remains unchanged and hence is determined up to an unknown proportionality constant D. Estimating D requires real migration data, and the authors try different values of D. Further, one assumption is that an individual migrating from a given node is equally likely to migrate to any of the other connected nodes. They also consider that travel by railways leads to a time delay. The authors simulate their model under two different initial conditions – only Delhi is initially infected, and six cities are initially infected. The main conclusion of the paper is that because of the connectivity of the cities, the peaks of the infection curves in the different cities occur very close to one another. They forecast that within 90 days from the start of the epidemic, most of the urban population will be exposed to the virus in the absence of preventative measures.
More Resources
The Hidden Geometry of Complex, Network-Driven Contagion Phenomena
Dirk Brockmann, Dirk Helbing – December 2013 – The Science Mag
COVID-19 and Italy: what next?
Andrea Remuzzi, Giuseppe Remuzzi – 13th March 2020 – The Lancet
Virus spread and voter model on random graphs with multiple type nodes
Ágnes Backhausz, Edit Bognár – 17th February 2020 – Preprint
Early dynamics of transmission and control of COVID-19: a mathematical modelling study
Centre for Mathematical Modelling of Infectious Diseases COVID-19 working group – 11th March 2020 – The Lancet