Tracking daily district data
We present here the time-series of some quantitative measures which track the spread of the epidemic in the country, using publicly available data. Note that the detected number of cases and thereby all these measures are affected by testing strategies that induce bias in the sampling. They are also affected by errors in the data due to mis-reporting of fatalities and recovered and randomness in the time lags in reporting them. Nevertheless, we feel that they provide a broad overview of the pan-India situation.
Note that there are no district-based data from Telengana, and therefore districts from there do not feature in the dashboard.
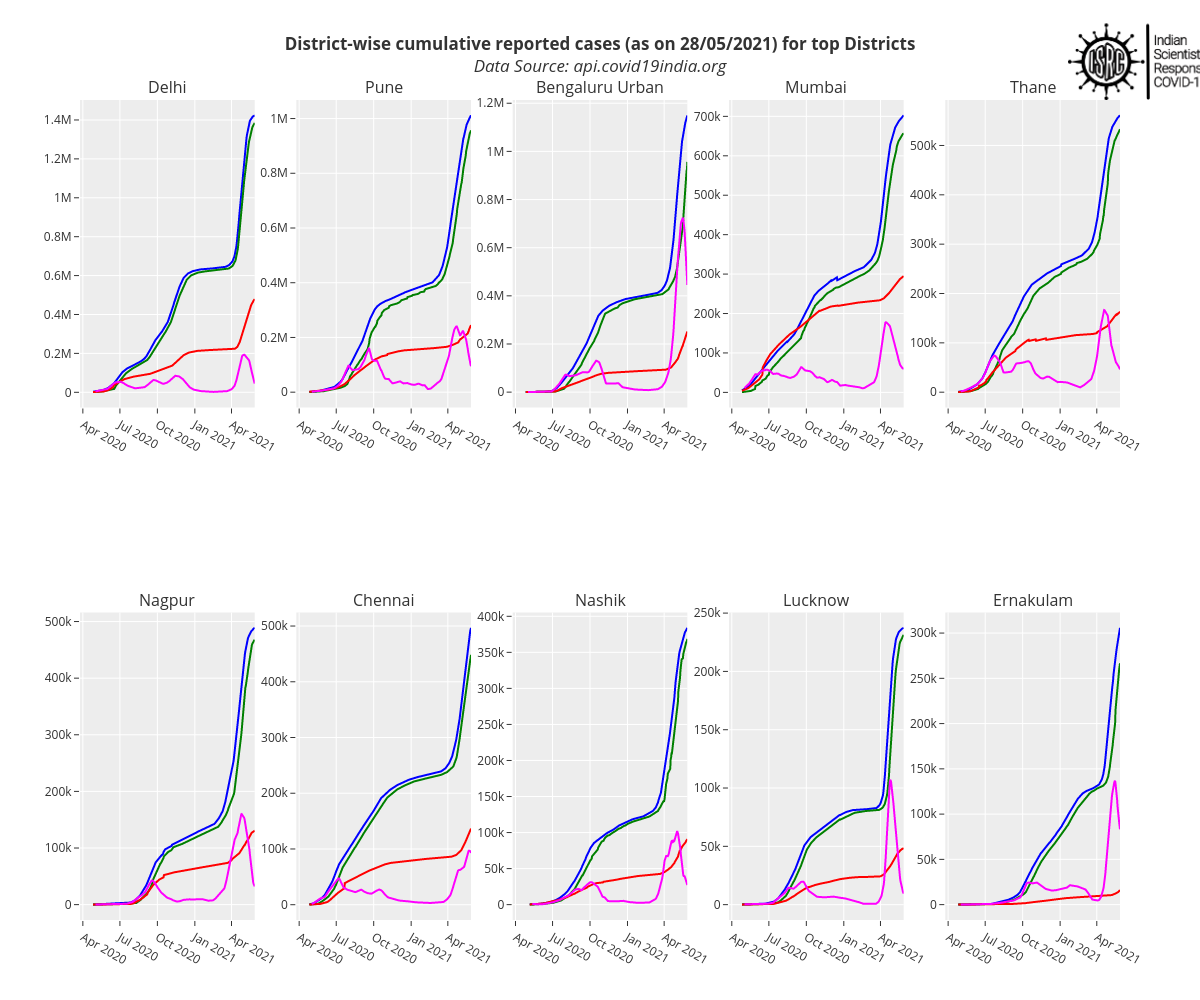
District wise data for reported numbers of infected, dead, recovered, active cases
How many cases have been detected and where are they ?
National numbers and their link to districts
Below is a bar chart showing the percentage contribution of detected confirmed cases (C), deceased cases (D), recovered cases (R) and active cases (A=C-R-D) for the top 20 districts contributing to the infections in India.
As can be seen, the distribution of the confirmed cases across the districts is not similar to the distribution of death, active and recovered cases. This indicates the level of heterogenity in the country.
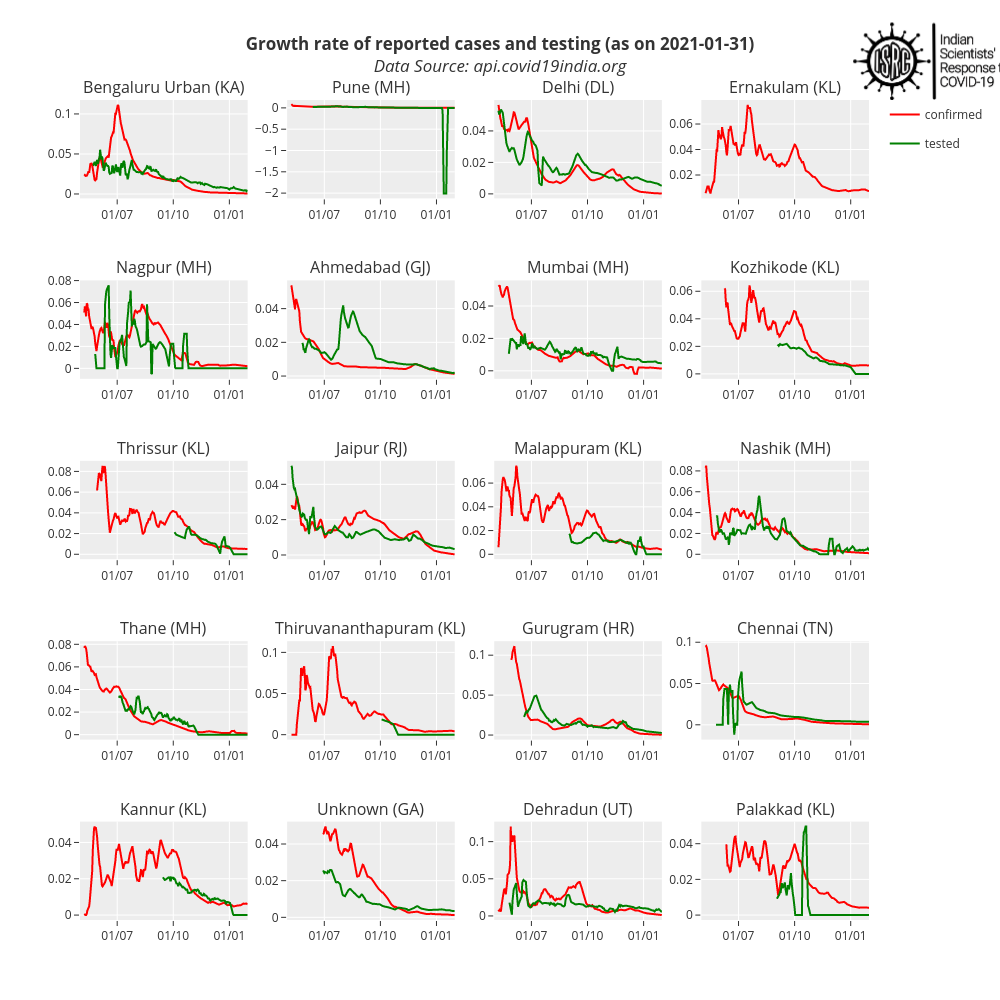
Growth rate of infections and tests
How rapidly are the cases growing ? How rapidly are the tests ramping up ?
The rate of growth of the cases at any point of time is inverse of the doubling time. Thus, the higher the rate the faster is the growth of the detected cases in the region. The oscillations seen in the data probably correspond to the detection and containment of clusters. However, since the data is noisy, the amount amplitude of the oscillations has large uncertainties. Also shown is the rate of tests being done, to check whether the increase in tests is keeping up with the increase in detected cases. Ideally, the ramping up of tests should be enough so that the rate of tests is larger than the rate of detection.
West Bengal does not publish district-wise testing data. Therefore those are missing in the panel below.
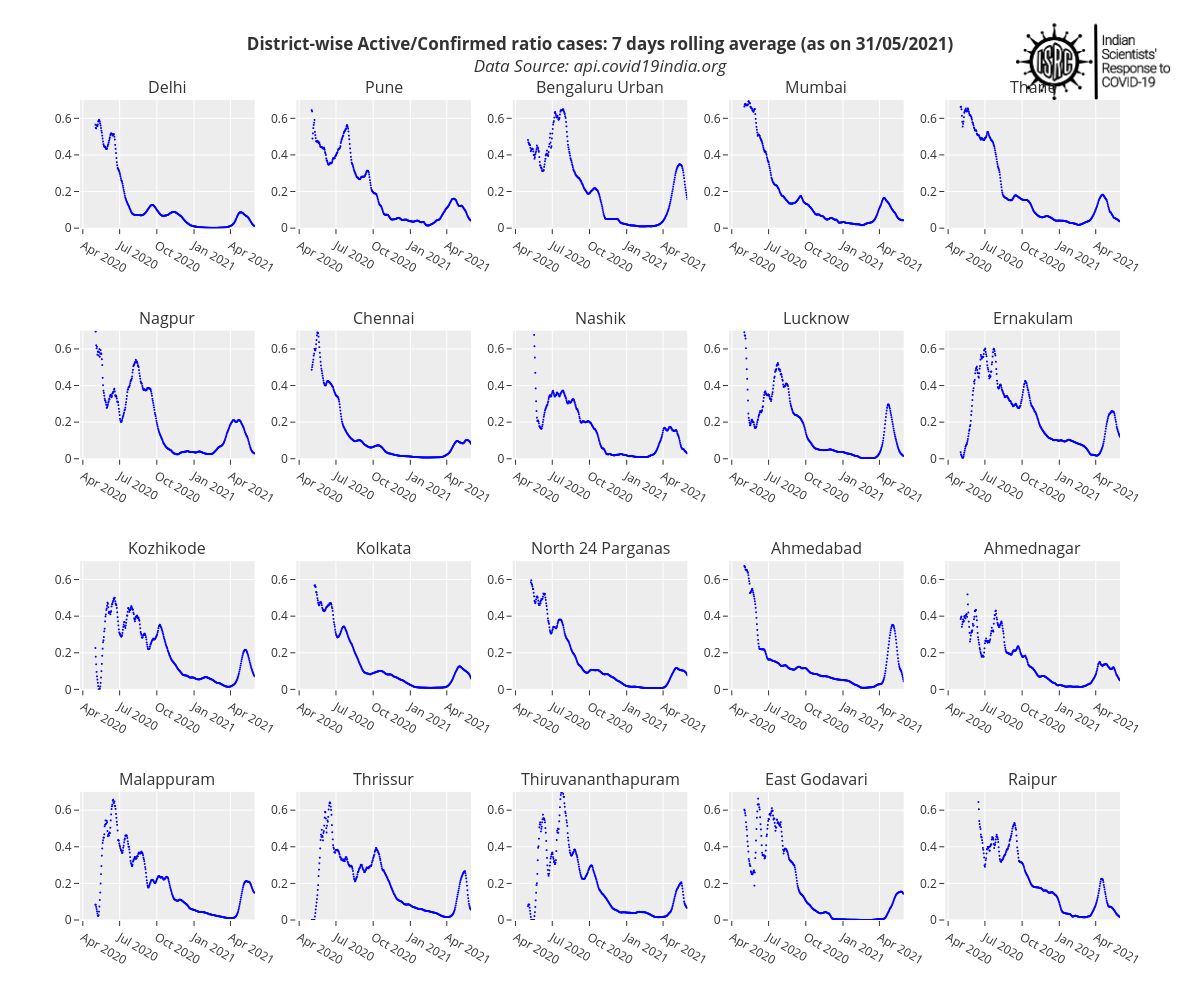
Fraction of cases that are active
Progress of the epidemic
We plot the ratio A/C=A/(A+R+D), where A is the number of detected active cases, C the number of detected cases, R the number of recovered and D the number of deceased. At the beginning of the epidemic, R=D=0 and hence A/C=1. At the end of the epidemic, A=0 and hence A/C=0. Thus this ratio can be taken to be a rough measure of the stage of the epidemic.
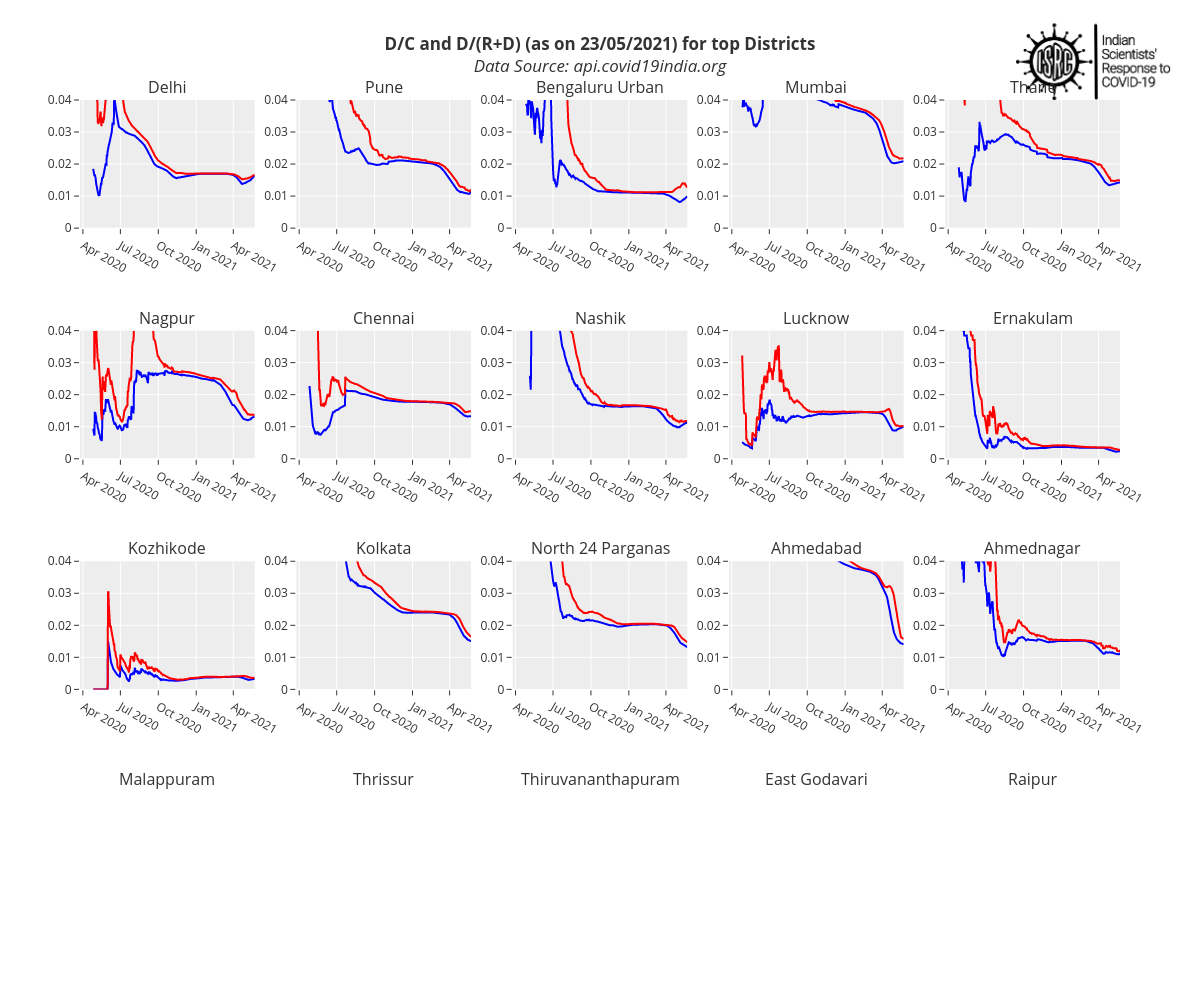
Case fatality ratio
How many undetected cases are there ?
The case fatality ratio (CFR) is the probability that a detected case will lead to mortality. During the epidemic, it is difficult to measure this ratio, at any time instant, since the fate of the active cases is unknown. However, in most situations, it will lie between the two quantities plotted below. Namely, D/C < CFR < D/(R+D). Assuming that most of the deaths are recorded, the CFR provides a measure of the number of undetected case.
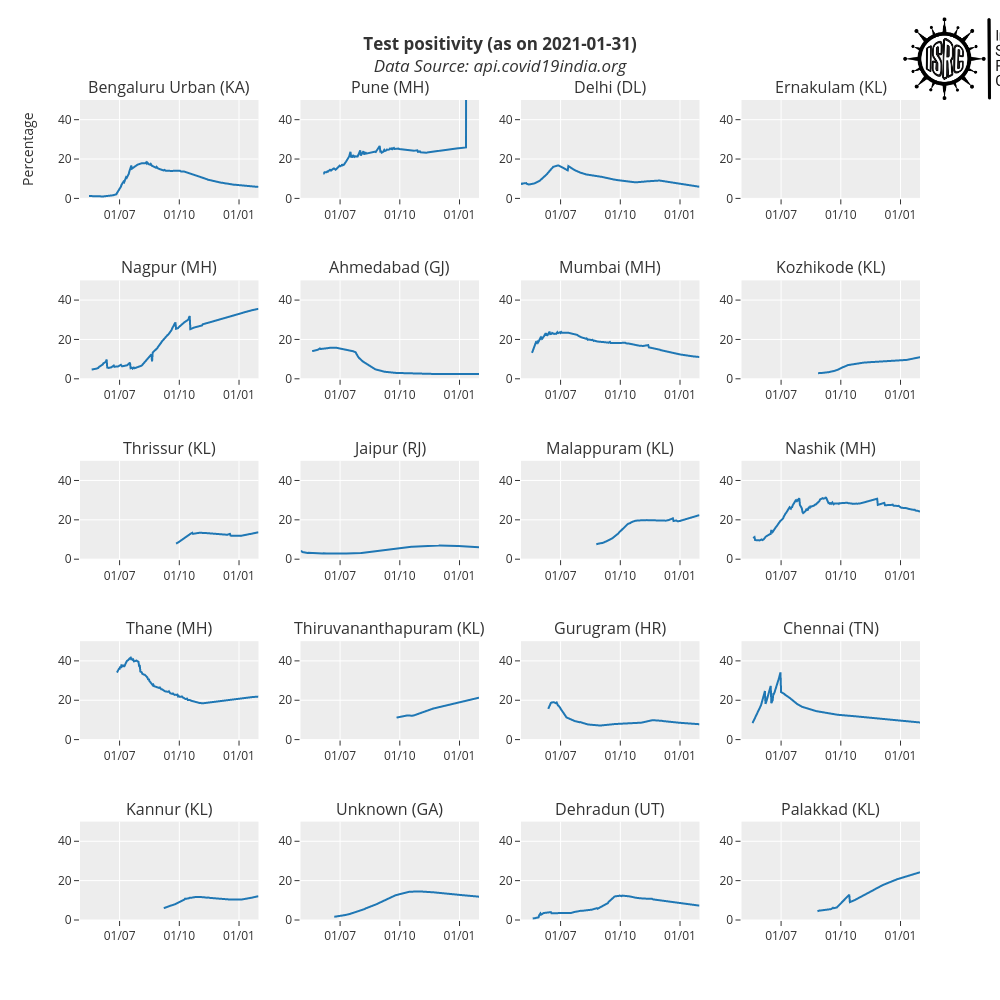
Test Positivity
How extensive is the testing ?
Test positivity is defined as the ratio of the number of detected positive cases to the total number of tests that have been done. It depends on (a) the prevalence of the infection in the region (b) The testing strategy. If most tests are done on cases which are clinically judged to have a high probability (eg symptomatic contacts of confirmed cases) the test positivity will be high. On the other hand if the the tests are done more extensively it will be low.
West Bengal does not publish district-wise testing data. Therefore those are missing in the panel below.